Point cloud visualization options
The right side pane in the point cloud view can be used to change the appearance
- Colours:
- RGB (normal colours, like a photo)
- Elevation (you can determine the range for elevation colours by clicking on the map at certain Z-values)
- Intensity (depending on data)
- Classification (depending on data)
- Edge effect (makes edges pop out)
- Adaptive points (the more sparse points the bigger points)
- Point size (adjust all point sizes)
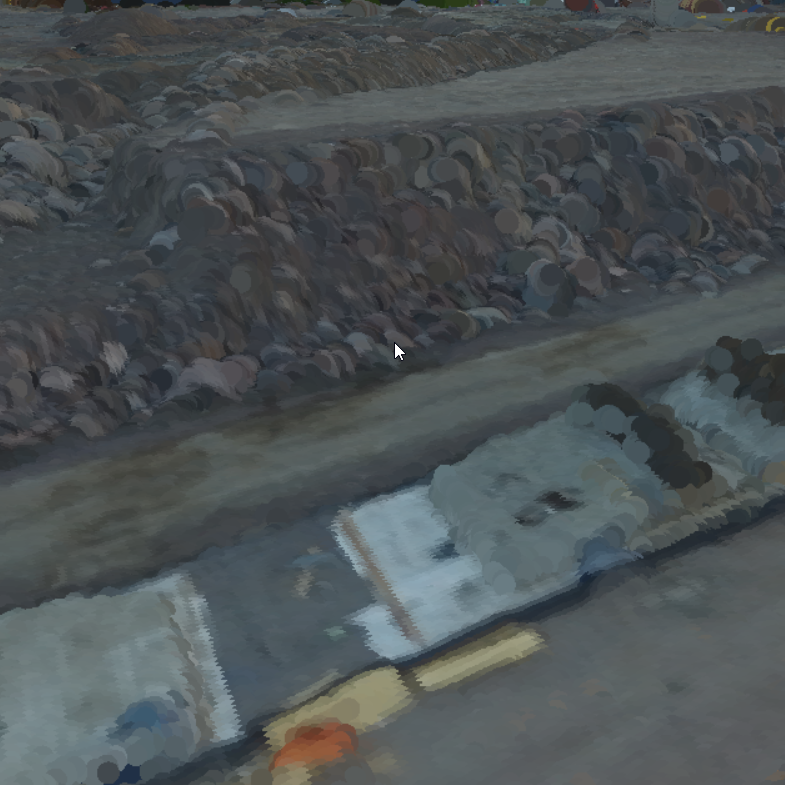
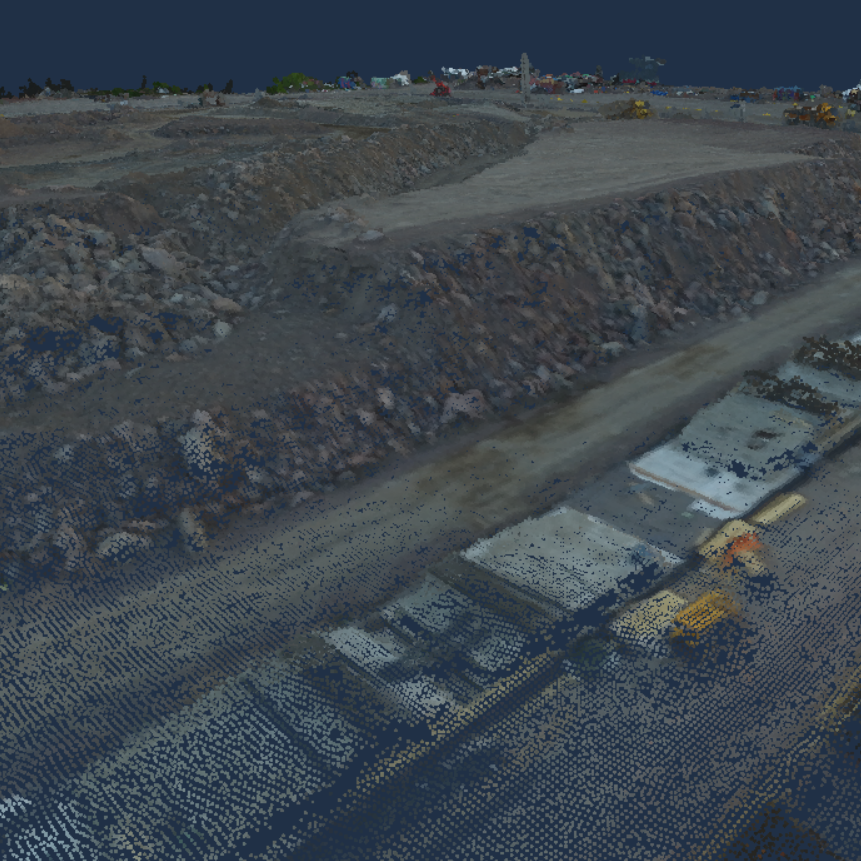 RGB, default.
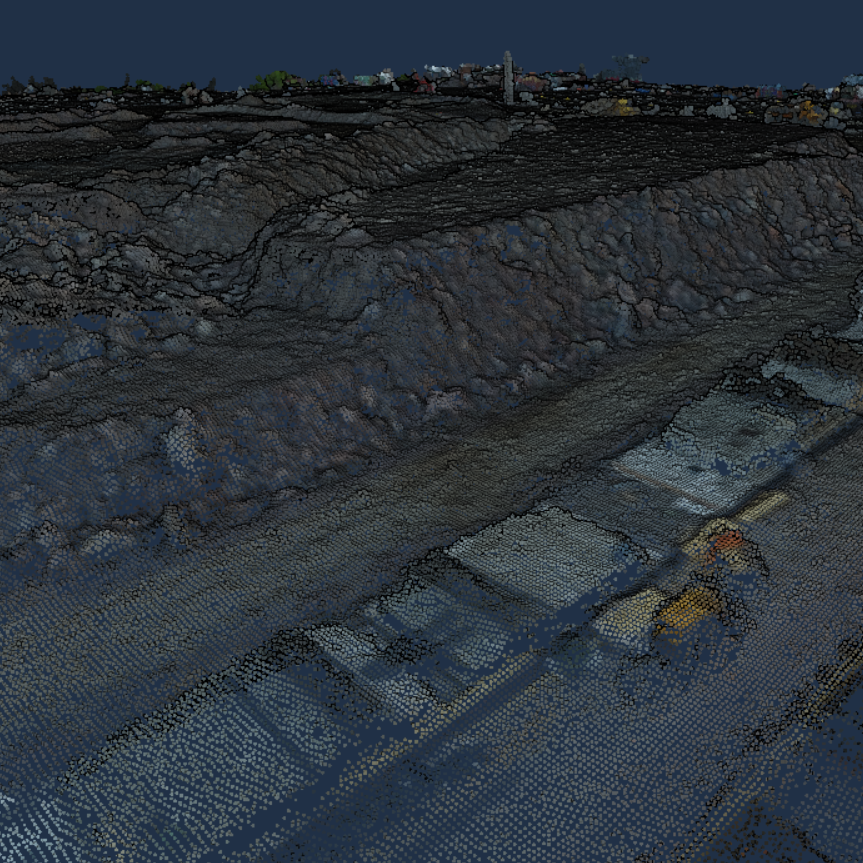 Edge effect, add contrast to all edges
 Point size, you may change the point size
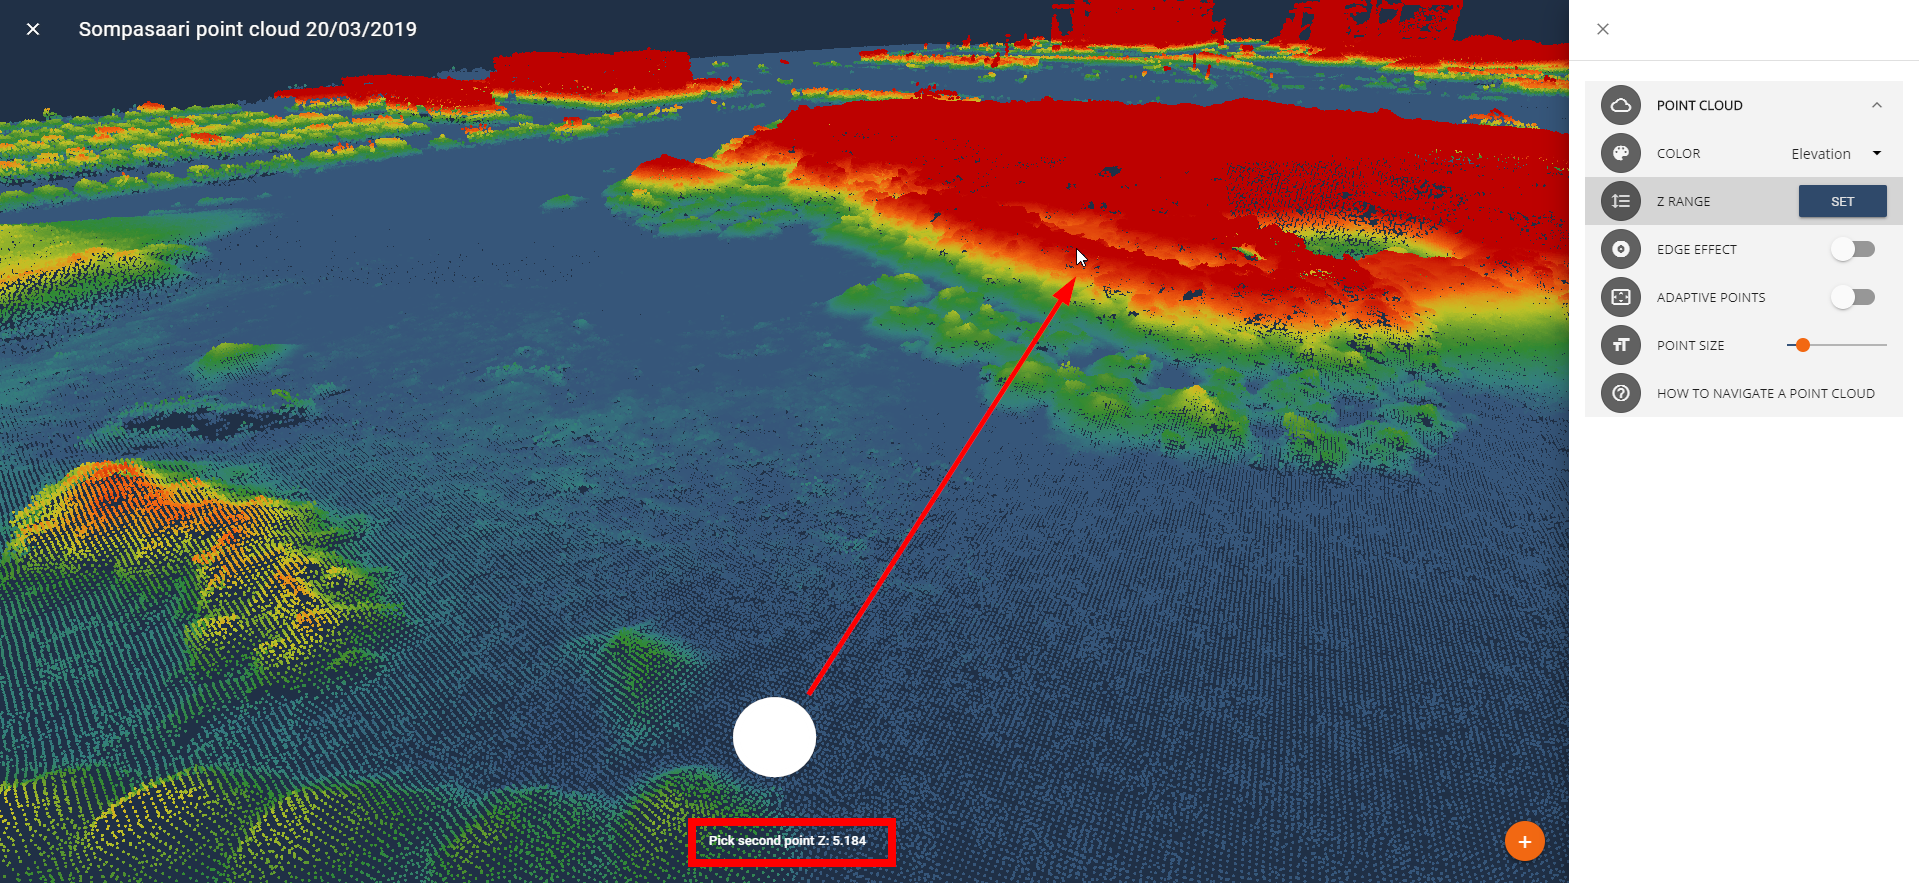
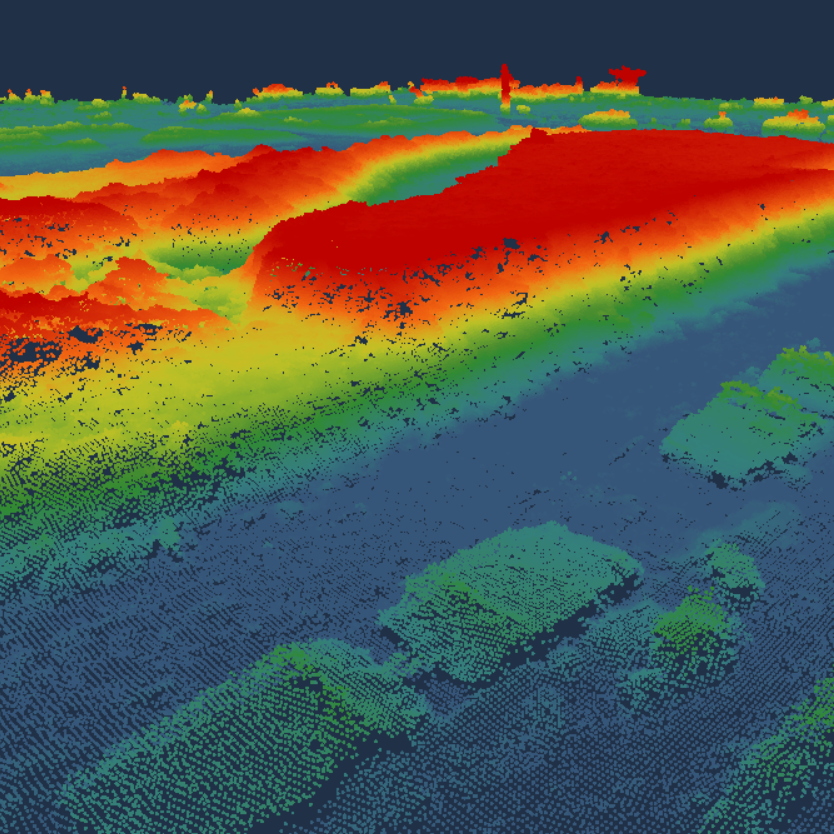 Elevation
Setting the Elevation range
1. Choose elevation, click SET, move onto the map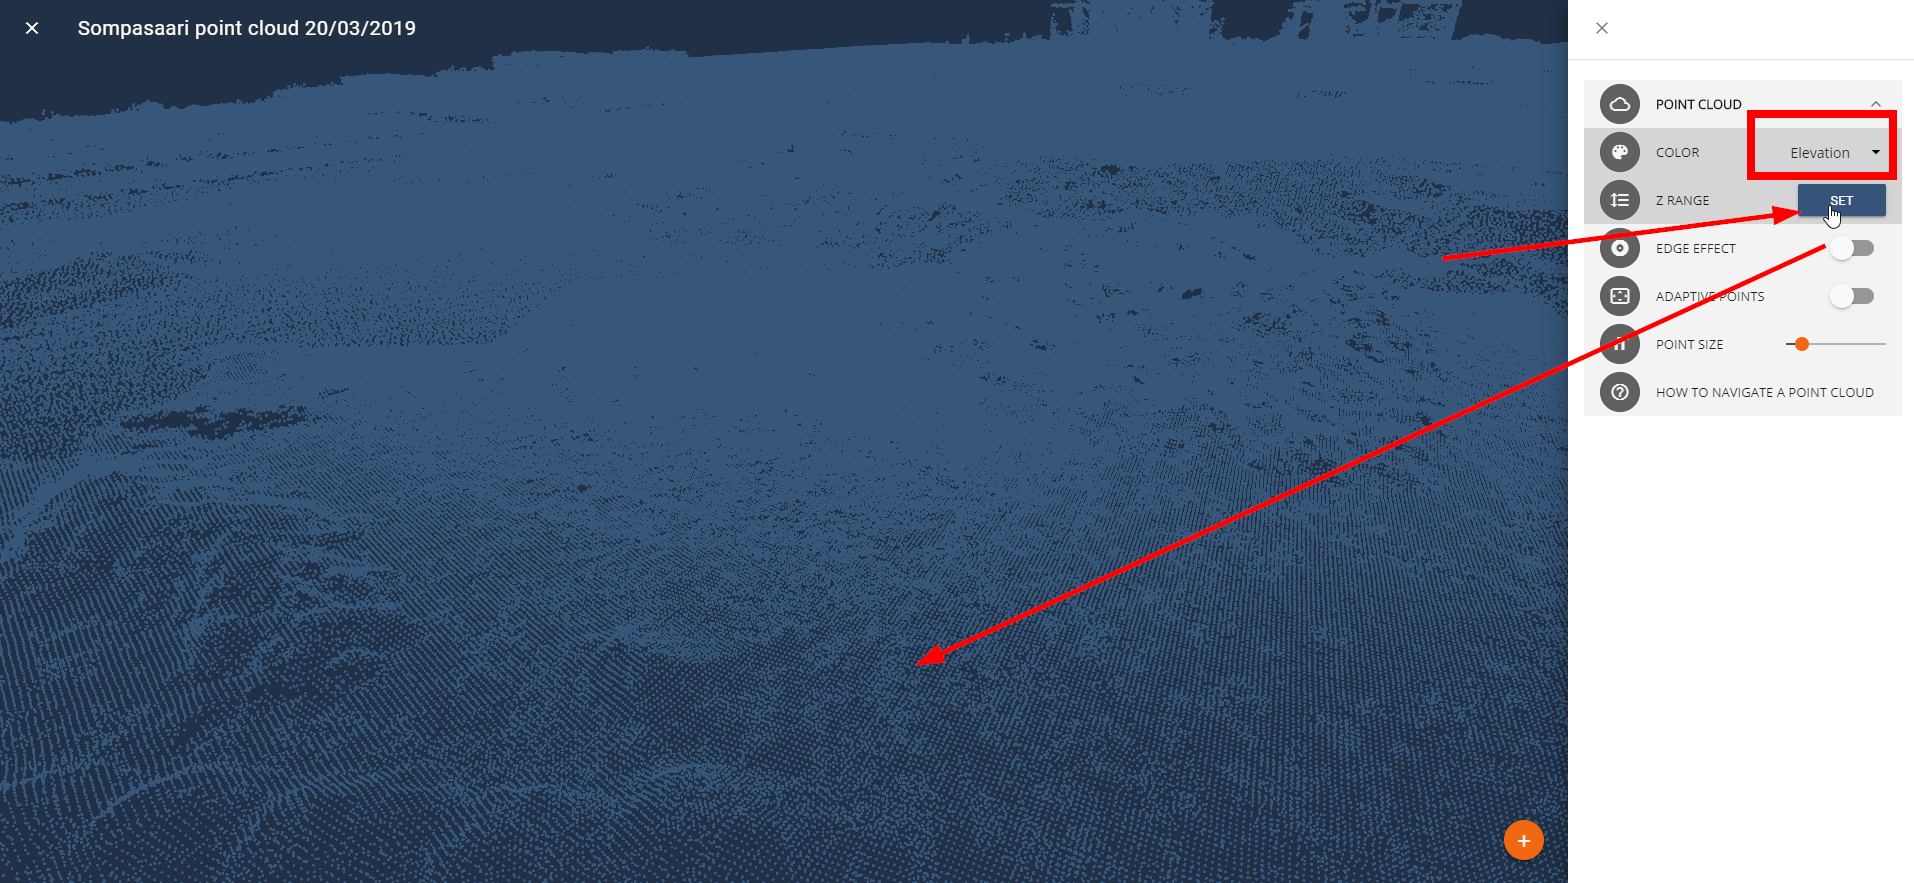
2. Click the first value on the map, z-value is shown on the bottom of the map.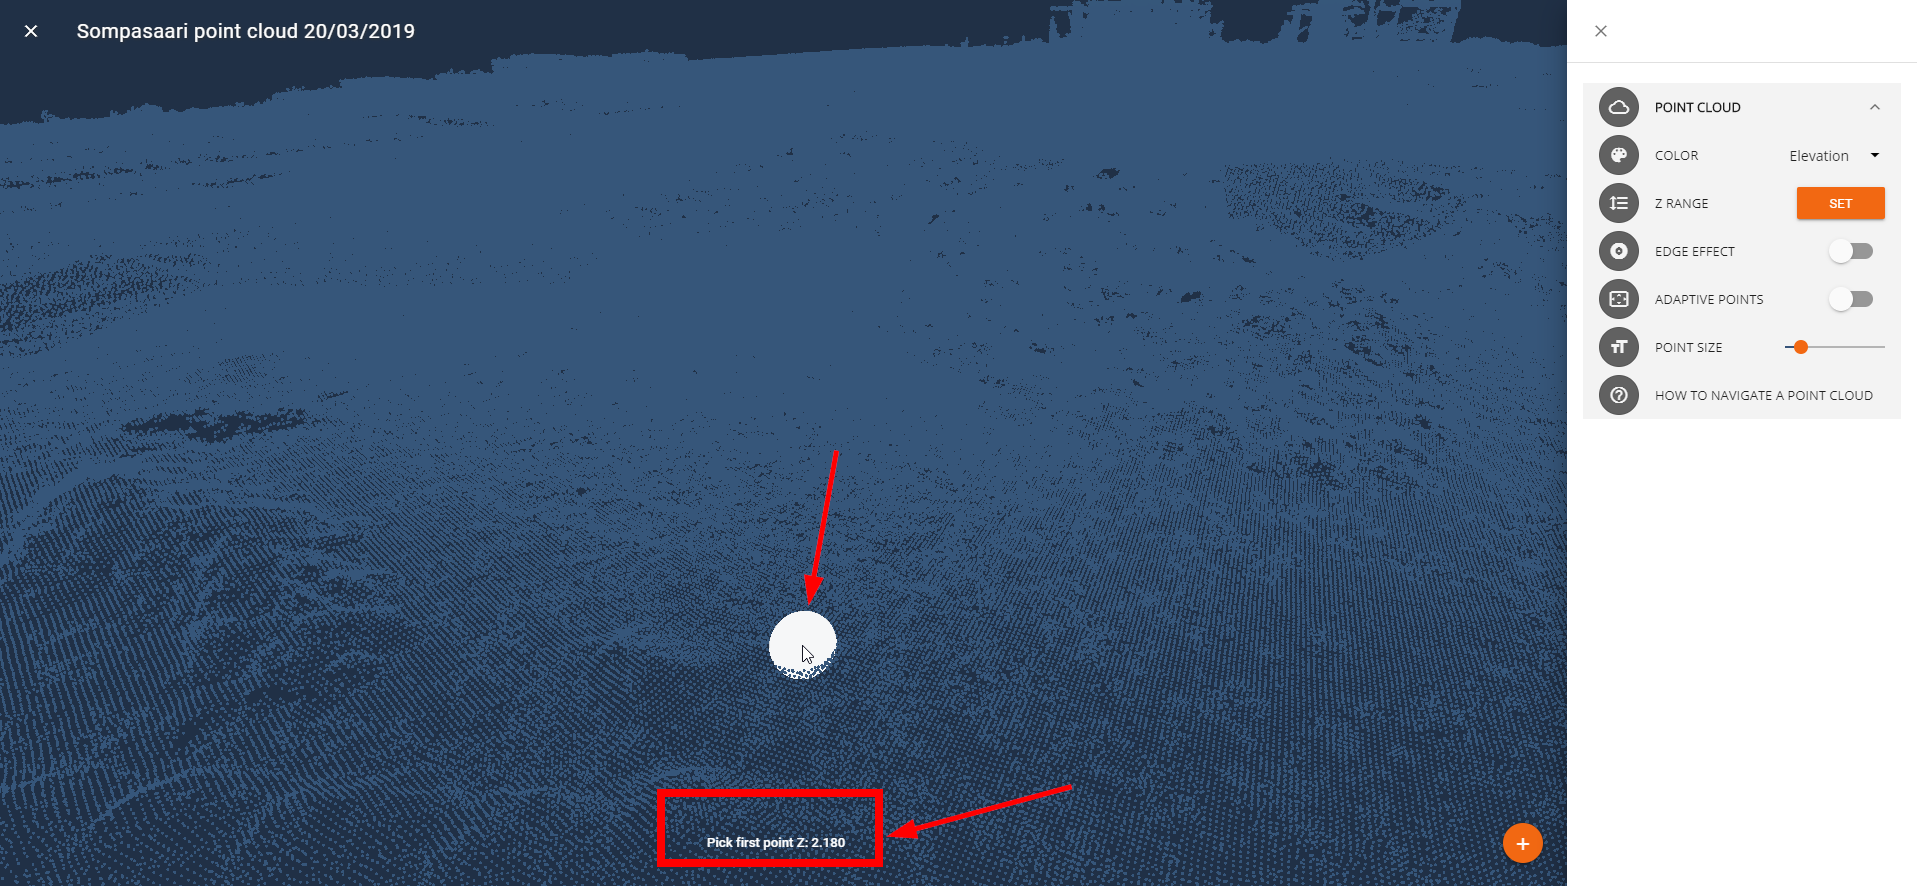
3. Click the second value for the colouring by moving the mouse to a higher place.